
 EN
EN
 ar
ar bg
bg hr
hr cs
cs da
da nl
nl fi
fi fr
fr de
de el
el hi
hi it
it ko
ko no
no pl
pl pt
pt ro
ro ru
ru es
es sv
sv tl
tl iw
iw id
id lv
lv lt
lt sr
sr sk
sk sl
sl uk
uk vi
vi et
et hu
hu th
th tr
tr fa
fa ms
ms hy
hy ka
ka ur
ur bn
bn mn
mn ta
ta kk
kk uz
uz ku
ku
Traversing Probe Systems
Flexible alarm rule configuration is a key feature of Kingmach Traversing Probe Systems. The platform can provide matching detailed fault information in real time when a structure fails or when monitoring logic identifies abnormal behavior. Alarm rules can be linked with project alarm levels, channel data, and maintenance needs. This helps users avoid treating every data movement the same way. A minor drift, a rapid jump, and a confirmed multi-channel abnormal pattern can be managed with different levels of attention.
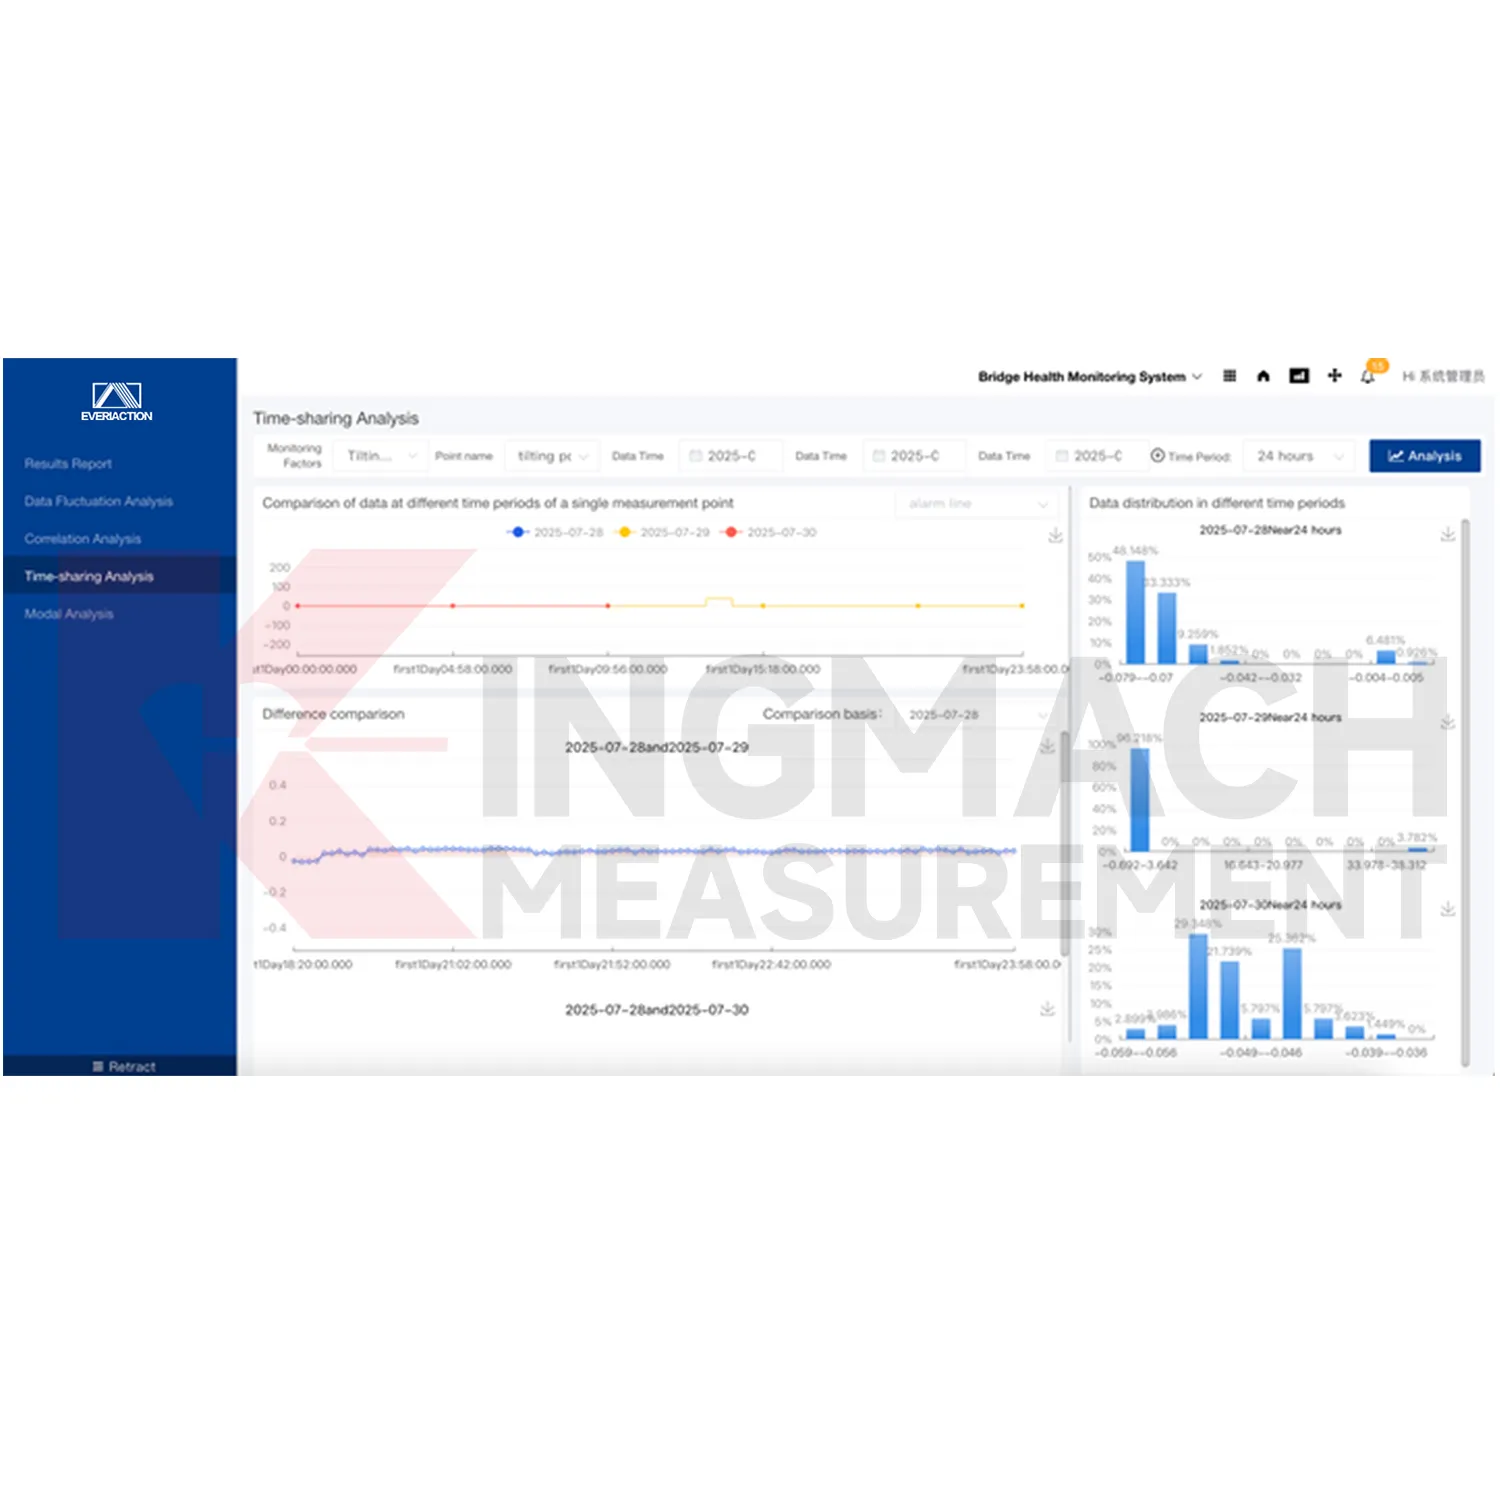
Application of Traversing Probe Systems
Dam and hydraulic structure monitoring uses Kingmach Traversing Probe Systems to manage water level, seepage, deformation, settlement, temperature, pressure, and gallery inspection records. These assets require long-term data continuity and careful alarm handling. The platform can store multi-dimensional data, show trends, and maintain project documents around the same asset. When an abnormal pattern appears, reviewers can compare the value with water level, rainfall, maintenance notes, and related sensors before deciding the next field action.
The future of Traversing Probe Systems
Future use of Kingmach Traversing Probe Systems will grow as civil engineering monitoring moves from isolated instrument readings to connected asset management. More structures will rely on sensors, acquisition modules, wireless devices, and cloud platforms to maintain a continuous safety record. The software layer will become the place where owners review not just one reading, but the relationship between trends, alarms, inspections, weather, construction, and maintenance work. A platform that integrates multiple data sources will be central to that shift.
Care & Maintenance of Traversing Probe Systems
When a project is handed over, Kingmach Traversing Probe Systems should include a clear operating package. The handover should cover project structure, device list, channel map, alarm rules, user accounts, report templates, backup method, maintenance records, and recent data quality notes. Training should show users how to read trends, respond to alarms, add documents, and export reports. A strong handover prevents the platform from becoming a passive screen and keeps it useful for daily structural safety management.
Kingmach Traversing Probe Systems
Kingmach Traversing Probe Systems supports remote monitoring by letting data move from devices to the Cloud Platform through wired or wireless transmission. This is important for assets that are hard to access, such as slopes, dams, tunnels, bridges, wind towers, and distributed infrastructure. Remote data does not remove the need for site inspection, but it helps teams decide when inspection is needed and where to focus. Real-time storage and filtering also help preserve event records when weather, construction, traffic, or equipment operation changes the monitoring pattern.
FAQ
Q: What certification is listed?
A: The product information lists GB50982-2014 certification.
Q: What is the minimum order quantity?
A: The local product page lists one piece as the minimum order quantity.
Q: What is the delivery time?
A: Delivery time is listed as instant for the software platform.
Q: How is pricing handled?
A: Pricing is listed as negotiable, so project scope, configuration, and integration needs should be confirmed with Kingmach.
Q: What payment term is shown?
A: The local product page lists T/T in advance.
Reviews
Ryan Lewis
Fast delivery and excellent product quality. The accelerometers and tiltmeters are highly reliable. Strongly recommend this company.
Joshua Clark
We ordered a full monitoring solution including sensors and data loggers. Everything works seamlessly together. Great supplier!
Latest Inquiries
To protect the privacy of our buyers, only public service email domains like Gmail, Yahoo, and MSN will be displayed. Additionally, only a limited portion of the inquiry content will be shown.
Amelia***@gmail.comSingapore
Hello, I am looking for visualization software for monitoring system data analysis. Please let me kn...
Sophia***@gmail.comUnited Kingdom
Good day, we need environmental monitoring sensors including temperature, humidity, and wind sensors...
Related product categories
- datalogger
- automated acquisition systems
- Wireless Data Collection Systems
- Data Acquisition
- Web-based Monitoring Software
- Monitoring system software platform
- Visualization Software
- Accessories
- Guidewheel Measuring Rod
- Monitoring system software platform
- Structural Health Monitoring Sensors
- Web-based Monitoring Software