 ar
ar bg
bg hr
hr cs
cs da
da nl
nl fi
fi fr
fr de
de el
el hi
hi it
it ko
ko no
no pl
pl pt
pt ro
ro ru
ru es
es sv
sv tl
tl iw
iw id
id lv
lv lt
lt sr
sr sk
sk sl
sl uk
uk vi
vi et
et hu
hu th
th tr
tr fa
fa ms
ms hy
hy ka
ka ur
ur bn
bn mn
mn ta
ta kk
kk uz
uz ku
ku
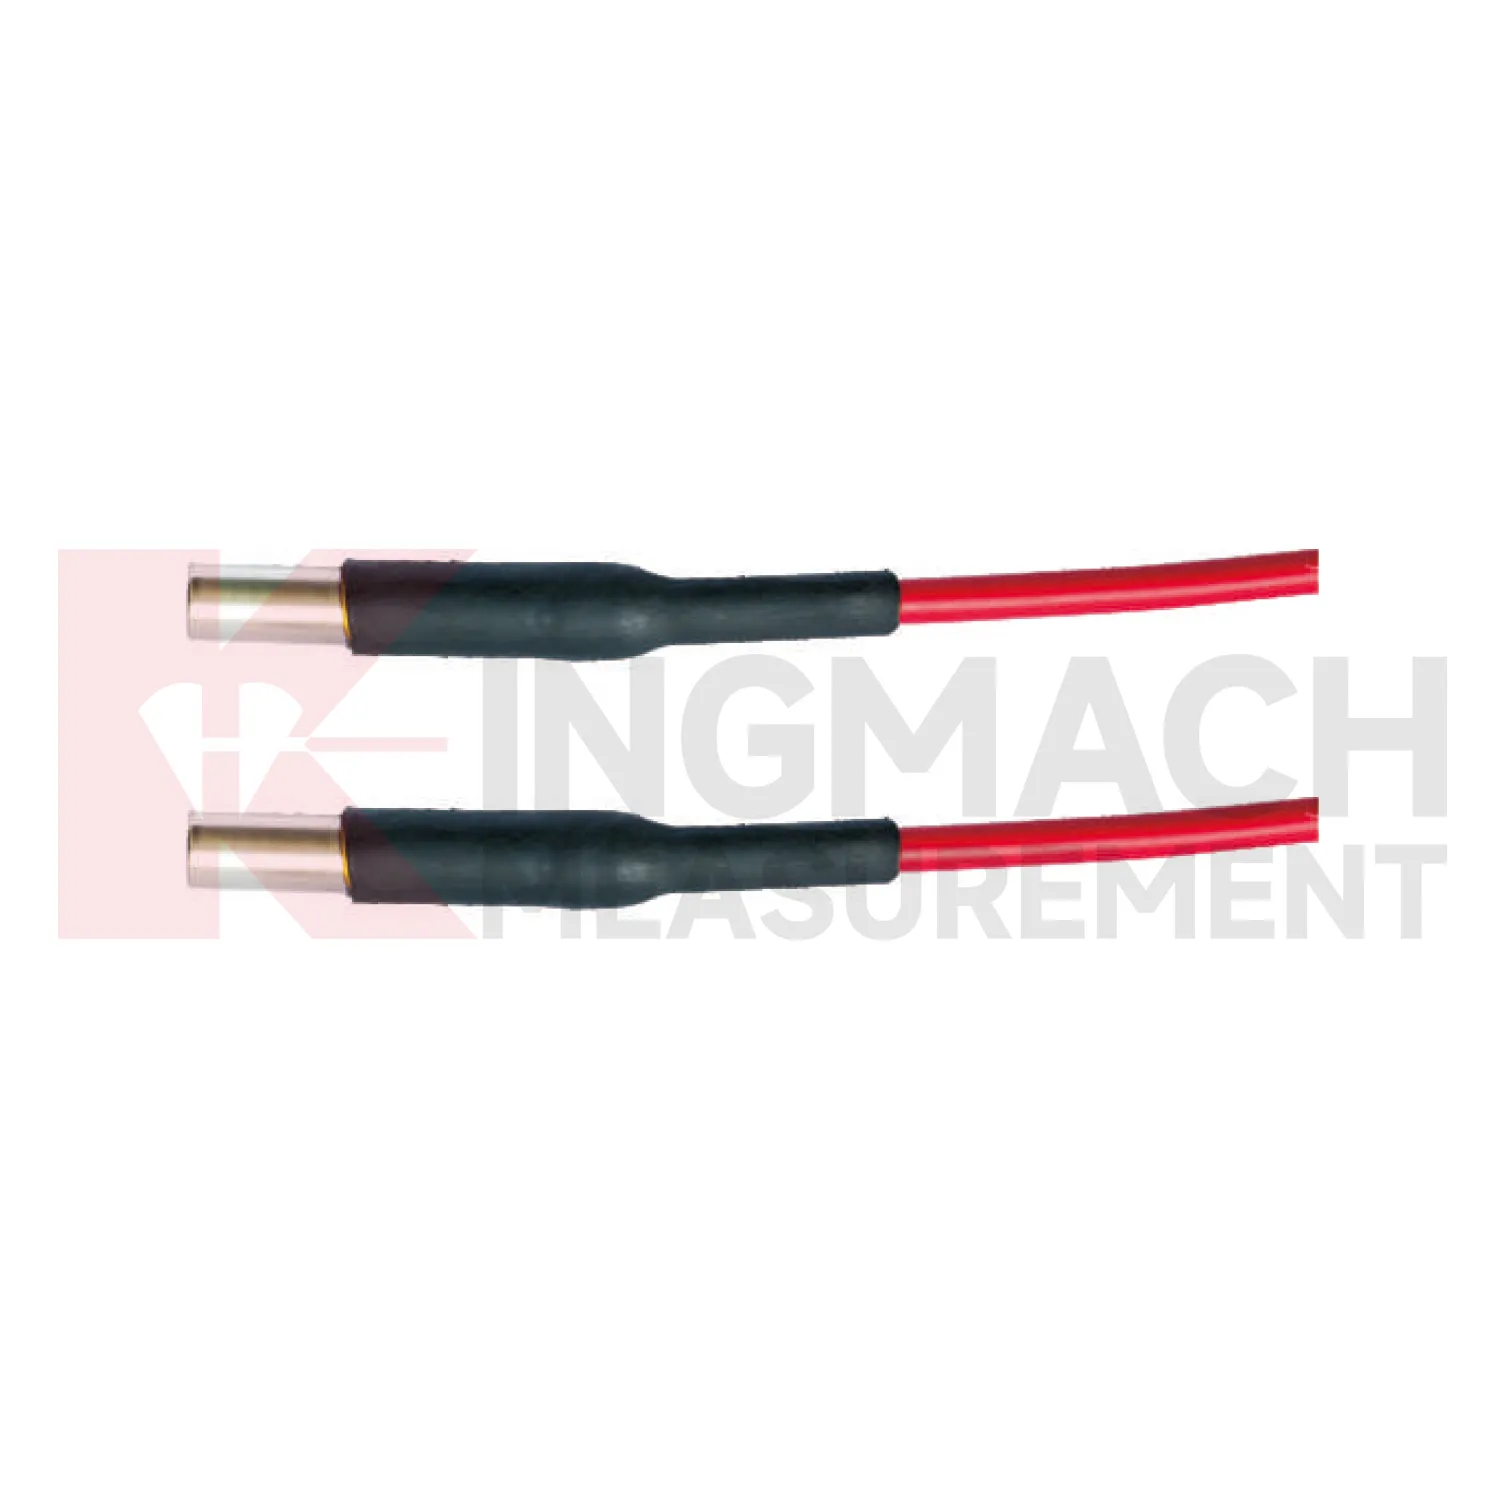
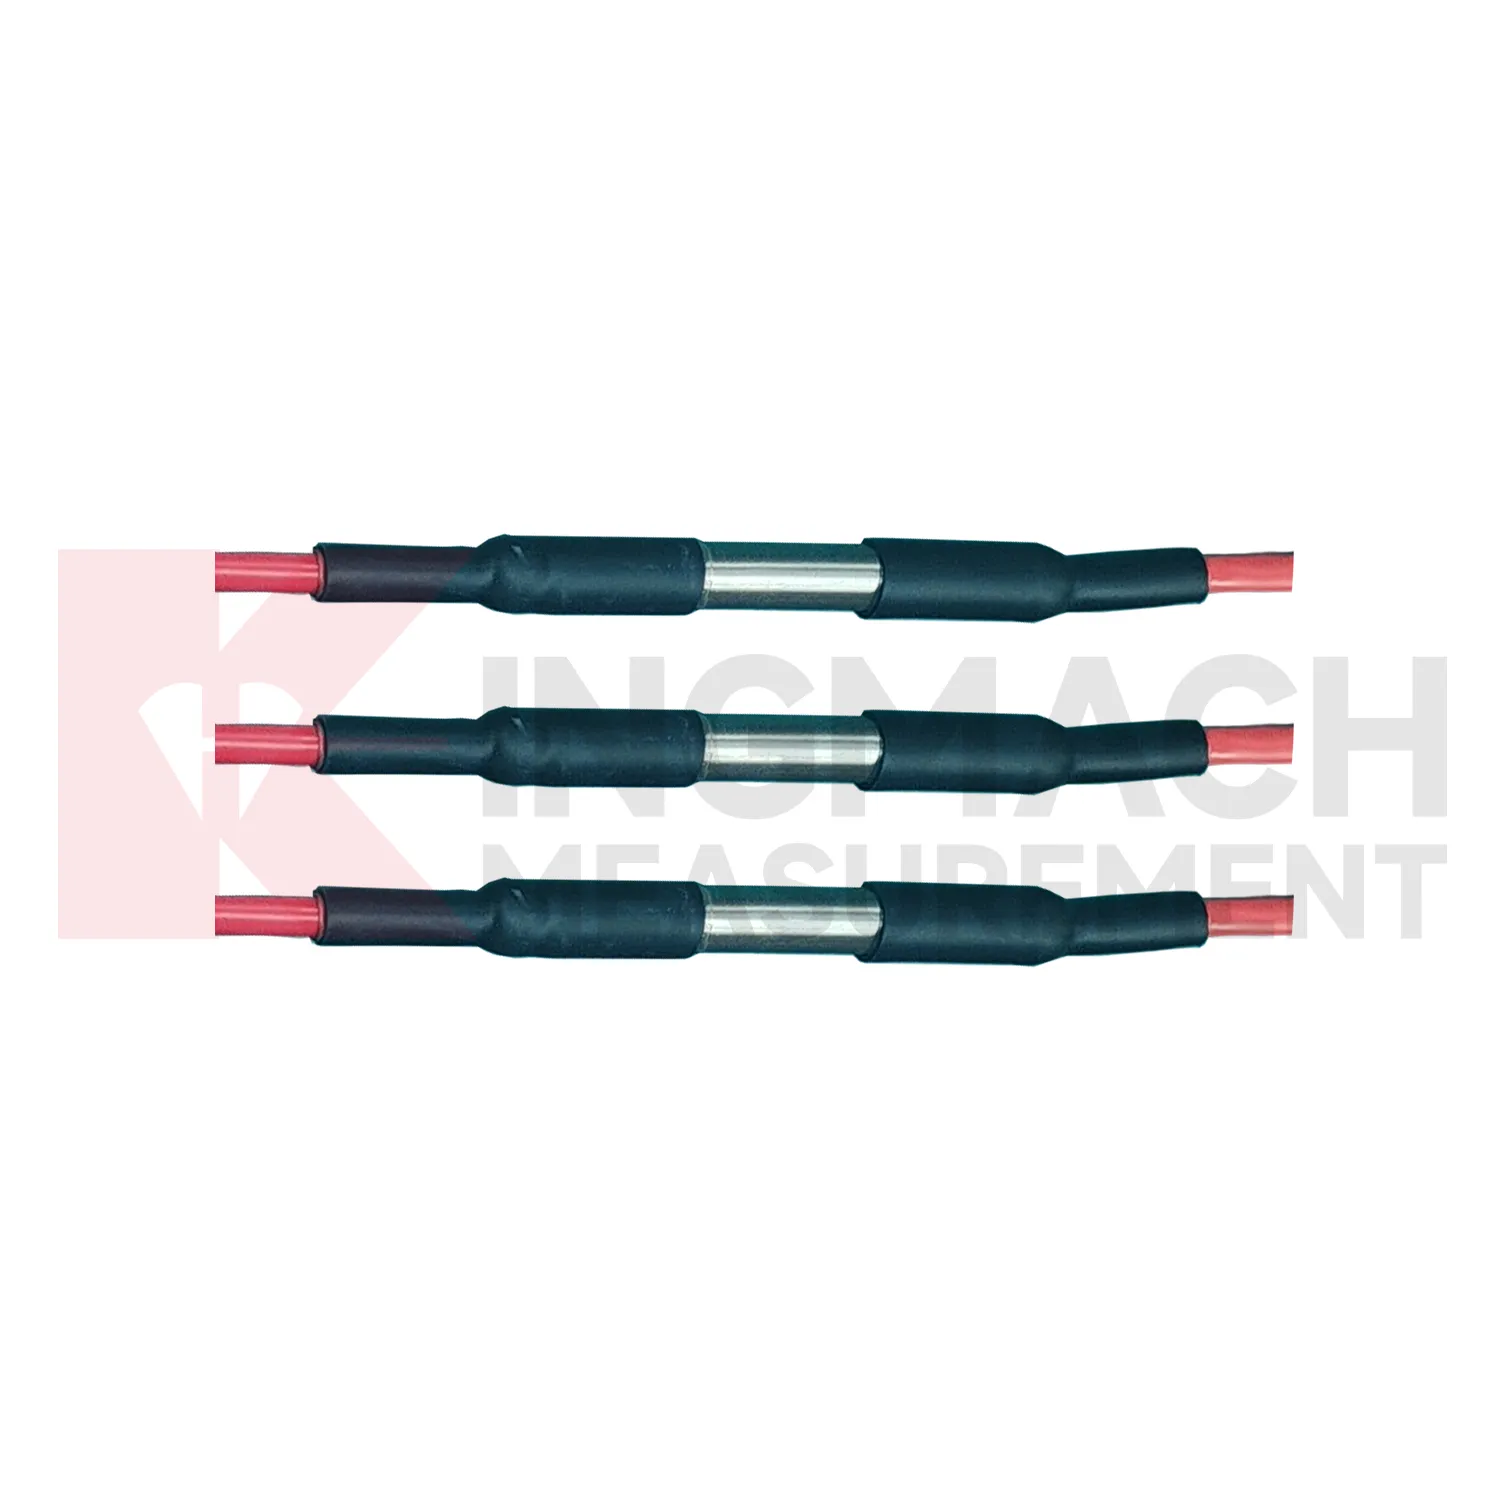
resistive temperature sensors
Temperature monitoring in Kingmach resistive temperature sensors gives engineers a way to separate environmental effects from structural change. Many materials expand and contract with heat. Sensors, cables, cabinets, and enclosures also behave differently under temperature stress. In bridges, temperature can affect strain and displacement records. In tunnels, it can interact with humidity and ventilation. In industrial areas, it may follow equipment operation. In energy, transportation, railway, and construction settings, a stable temperature record helps reviewers avoid treating a thermal pattern as a structural defect. The monitoring point should be placed according to the question being asked: material temperature, air condition, cabinet environment, or general site exposure. Each placement tells a different story, and the report should make that difference clear.
A good review habit is to compare the condition channel with the nearest asset behavior instead of reading it as a standalone weather value. That keeps the record tied to slope movement, bridge response, tunnel equipment, dam seepage, drainage behavior, or cabinet reliability.
The installation file should explain why the location represents the monitored area. If the point is sheltered, shaded, exposed, buried, elevated, or placed inside an enclosure, that fact changes how later readings should be understood by maintenance staff.
During abnormal events, the first question is not only whether the value crossed a limit. The reviewer should ask what changed around the site, whether the related structure reacted, and whether a field inspection confirmed the same pattern.

Application of resistive temperature sensors
Bridge projects use Kingmach resistive temperature sensors to understand the conditions that surround structural response. Wind can drive vibration and deck movement. Temperature can affect expansion, strain, and displacement. Humidity and rain can influence cabinets, connectors, corrosion, and inspection timing. A bridge record becomes more useful when environmental channels are aligned with traffic, strain, acceleration, tilt, settlement, and visual inspection data. Placement matters: wind data should represent the bridge exposure, temperature should match the structural or air condition being reviewed, and cabinet humidity should be measured near the equipment it may affect. During a vibration alarm, engineers can check whether the event matched strong wind, temperature swing, heavy rain, or unusual traffic. That context helps separate normal operating response from behavior that deserves a field review.
The environmental point should be part of a named monitoring question. It may explain wetting, drying, wind exposure, thermal movement, cabinet stress, or pressure variation, but that purpose needs to be visible in drawings and reports.
If the reading seems unusual, the team should check the physical condition of the station before drawing conclusions about the asset. Blockage, poor exposure, loose wiring, water entry, and changed surroundings can all create misleading patterns.
A practical report links the condition value with time, place, and action. It should help a reviewer decide whether to keep observing, inspect the field point, compare nearby instruments, or record the event as normal site behavior.
The future of resistive temperature sensors
Climate exposure will influence future Kingmach resistive temperature sensors requirements. Infrastructure owners increasingly face heat, heavy rain, high humidity, strong wind, ice, corrosion, and rapid weather changes. Monitoring stations must remain useful through those conditions, not only measure them. Future specifications should pay attention to enclosure access, cleaning needs, cable aging, connector protection, mounting stability, and weather-event history. Long-term records can help owners see whether repeated exposure affects an asset or the monitoring station itself. The future of environmental measurement is therefore both about recording the environment and keeping the record reliable while the environment is harsh.
If the reading seems unusual, the team should check the physical condition of the station before drawing conclusions about the asset. Blockage, poor exposure, loose wiring, water entry, and changed surroundings can all create misleading patterns.
A practical report links the condition value with time, place, and action. It should help a reviewer decide whether to keep observing, inspect the field point, compare nearby instruments, or record the event as normal site behavior.
Care & Maintenance of resistive temperature sensors
Temperature and humidity maintenance for Kingmach resistive temperature sensors should preserve the meaning of the measured environment. A point near a heater, vent, dripping pipe, open door, direct sun patch, or unrelated cabinet may not represent the target area. Inspect sensor position, dust, condensation, cable strain, cabinet sealing, and ventilation changes. If a temperature or humidity curve changes abruptly, check whether equipment operation, airflow, water entry, or maintenance work changed at the same time. Air-condition records are especially useful in tunnels, subways, factories, mines, shopping areas, construction rooms, and equipment enclosures. Careful placement and notes keep the record tied to the actual environment.
For owners, the strongest record is the one that remains understandable after staff changes. Clear units, plain point names, installation photos, maintenance notes, and linked structural channels make the data usable beyond the original project team.
For field teams, this point is most useful when the record shows the condition before the structural response, during the response, and after the site returns to routine operation. The note should include weather timing, inspection access, nearby construction, and whether the linked structural points changed in the same period.
Kingmach resistive temperature sensors
Kingmach resistive temperature sensors helps engineering teams read the conditions around a structure before they judge the structure itself. Temperature, humidity, rainfall, wind, pressure, and soil wetness can all change how bridges, tunnels, slopes, buildings, dams, and construction sites behave. A deformation curve after a storm is different from the same curve during a dry week. A strain record during a heat wave needs a temperature background. A cabinet fault in a tunnel may have more to do with moisture than with the instrument connected to it. The purpose of this category is to make those surrounding conditions visible. When environmental records sit beside settlement, displacement, tilt, load, vibration, and inspection notes, engineers can explain why a reading changed instead of only seeing that it changed.
For field teams, this point is most useful when the record shows the condition before the structural response, during the response, and after the site returns to routine operation. The note should include weather timing, inspection access, nearby construction, and whether the linked structural points changed in the same period.
FAQ
Q: What maintenance does Kingmach resistive temperature sensors need?
A: Maintenance includes cleaning, leveling, exposure checks, cable inspection, enclosure checks, unit verification, and data-quality review.
Q: What should be checked after storms?
A: Check rain catchment, cabinet water entry, cable damage, wind mounting, soil-point disturbance, and the first stable data after inspection.
Q: What causes misleading records?
A: Poor placement, blocked catchment, sheltered wind exposure, weak soil contact, water in cabinets, channel swaps, or missing maintenance notes can mislead reviewers.
Q: How often should inspections happen?
A: Frequency depends on exposure, asset risk, access, weather season, and how strongly the environmental data affects engineering decisions.
Q: How should replacement be handled?
A: Record the old and new condition, date, reason, point photo, channel change, and first stable value after replacement.
The environmental point should be part of a named monitoring question. It may explain wetting, drying, wind exposure, thermal movement, cabinet stress, or pressure variation, but that purpose needs to be visible in drawings and reports.
Reviews
Christopher Martinez
Very satisfied with the readouts & data loggers. User-friendly interface and supports multiple sensor inputs.
David Wilson
We purchased displacement transducers and settlement sensors, and the quality exceeded our expectations. Easy installation and reliable performance.
Latest Inquiries
To protect the privacy of our buyers, only public service email domains like Gmail, Yahoo, and MSN will be displayed. Additionally, only a limited portion of the inquiry content will be shown.
Amelia***@gmail.comSingapore
Hello, I am looking for visualization software for monitoring system data analysis. Please let me kn...
Charlotte***@gmail.comUnited Arab Emirates
Hi, we require instrumentation cables suitable for harsh environments. Could you advise on specifica...
Related product categories
- tipping bucket rain gauge 0.2 mm resolution standard
- tipping bucket rain gauge data logger
- tipping bucket rain gauge resolution 0.1 mm typical
- tipping bucket rain gauge resolution 0.2 mm typical
- tipping bucket rain gauge typical resolution 0.2 mm standard
- typical tipping bucket rain gauge resolution 0.2 mm standard
- Temperature Sensor
- Chain-type Temperature Sensor
- Temperature String
- Daisy-Chained Digital Thermometer
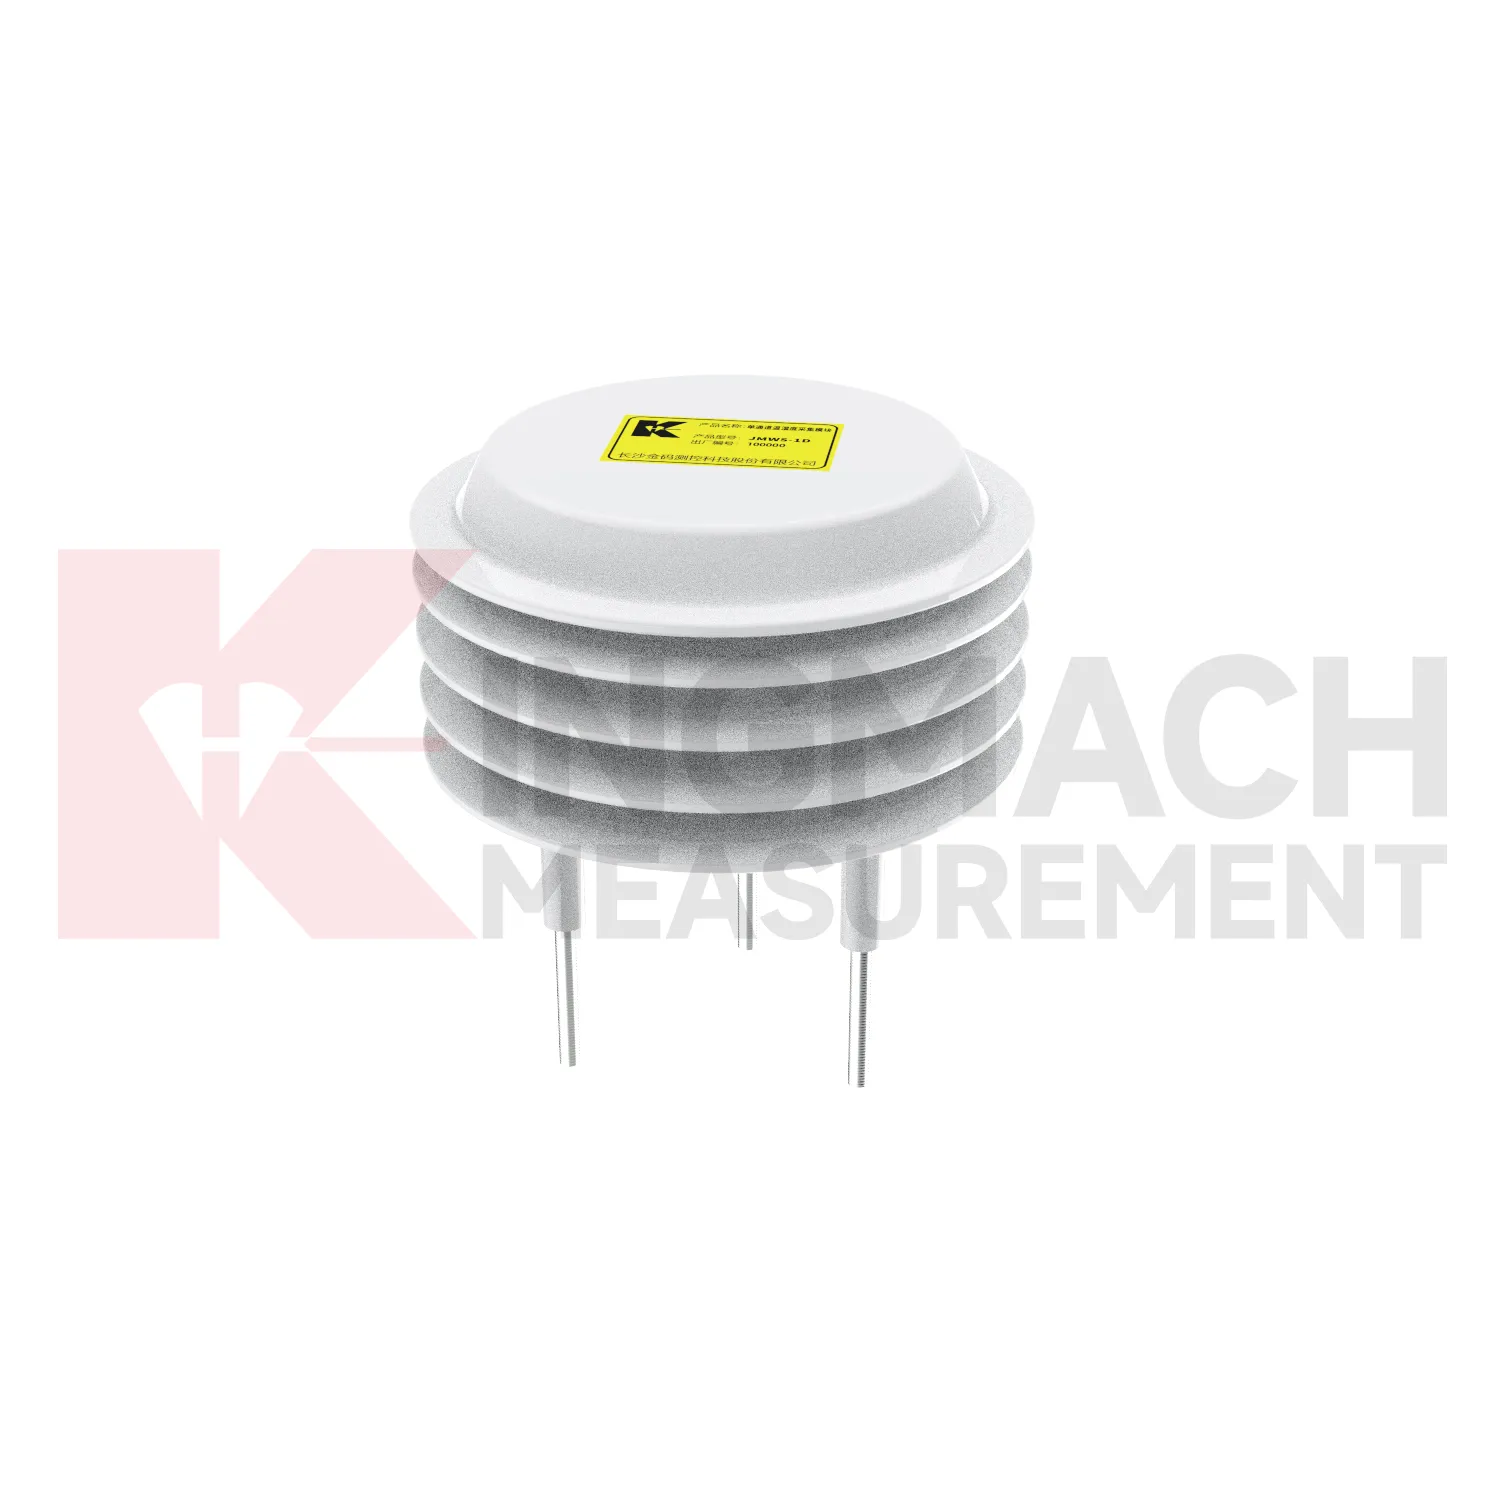
- Single-Channel Temperature and Humidity Acquisition Module
- Environmental Monitoring